
Finland-Sweden Economic Comparison
tbd
Demography
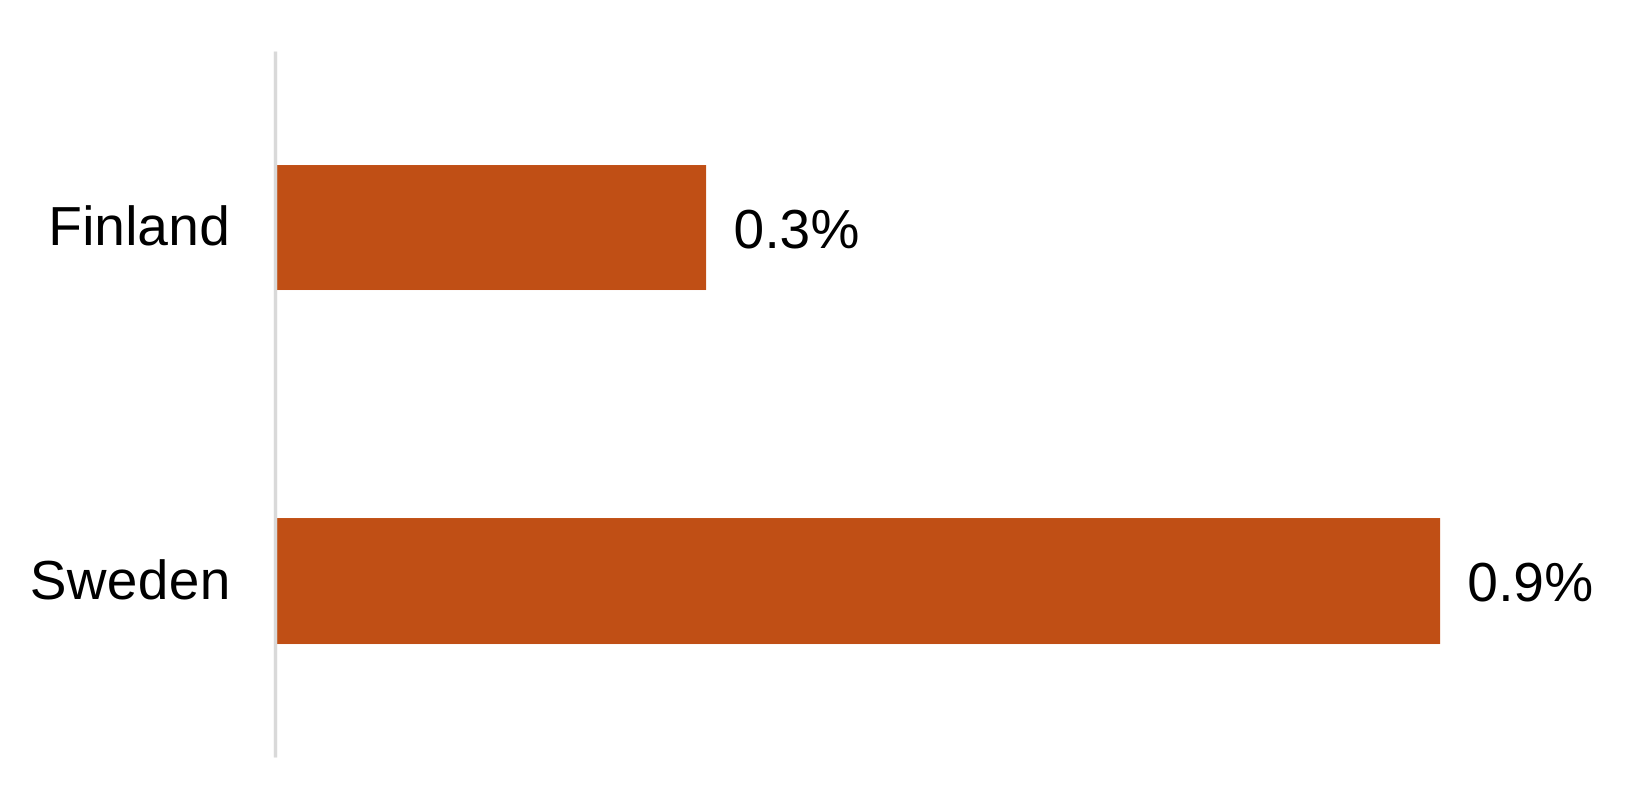
Before looking at GDP, it is important to understand the demographic differences. Sweden has had much higher population growth than Finland (figure 1)
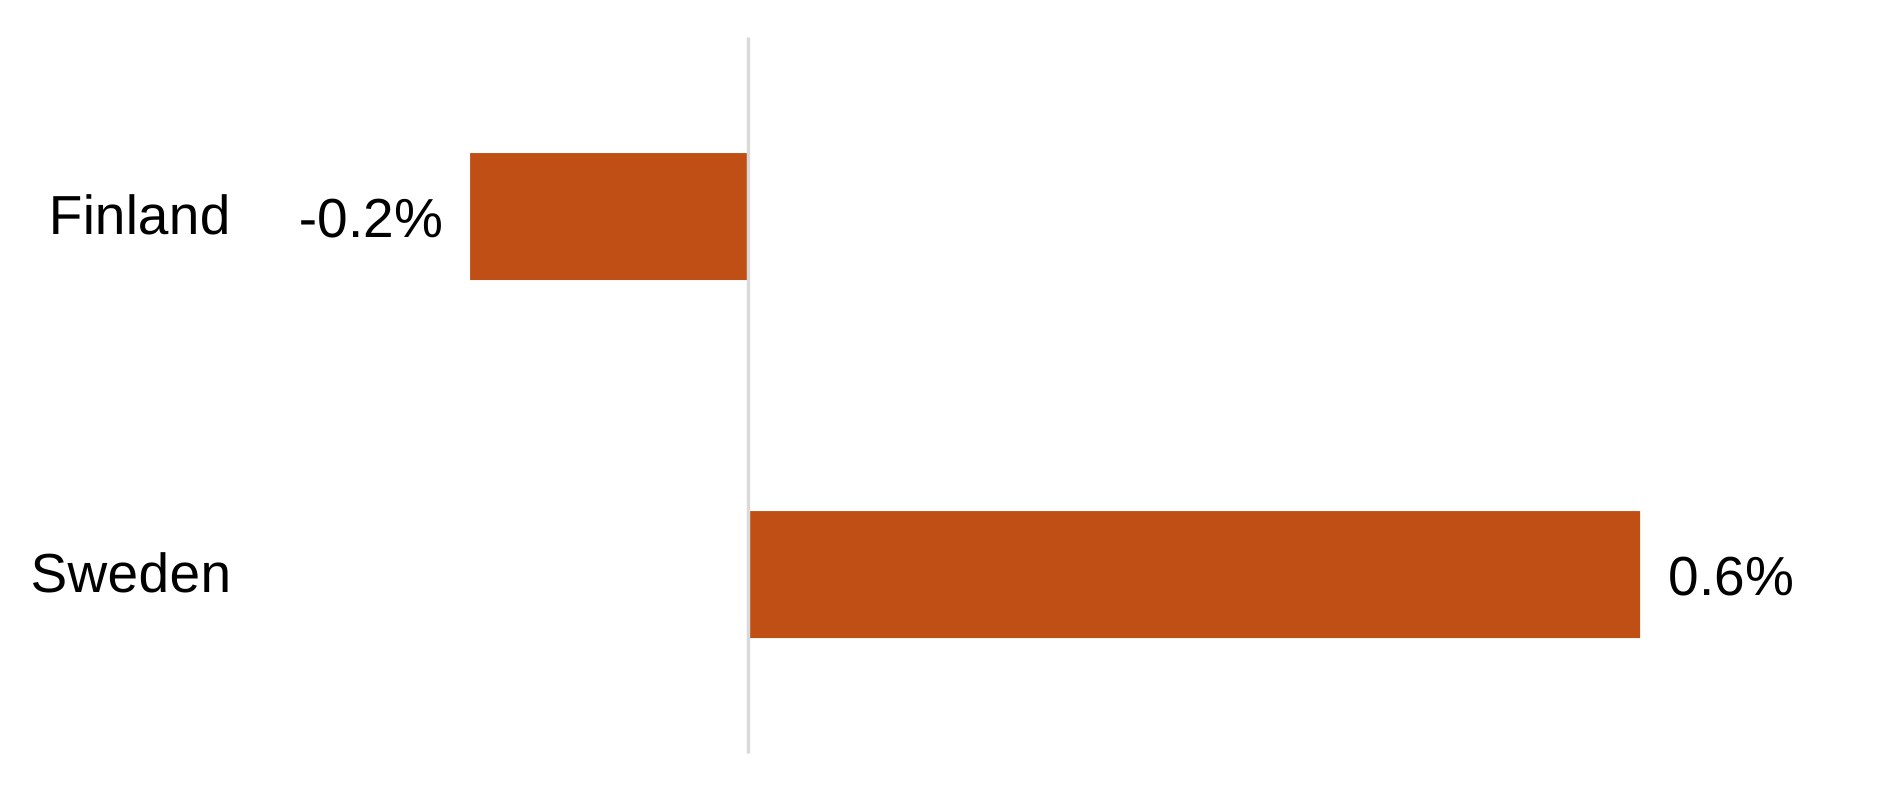
More importantly, economic growth is in mainly a function of the growth in working-age population, not total population. Here, Finland lags even more (figure 2).
Gross Domestic Product and Labor
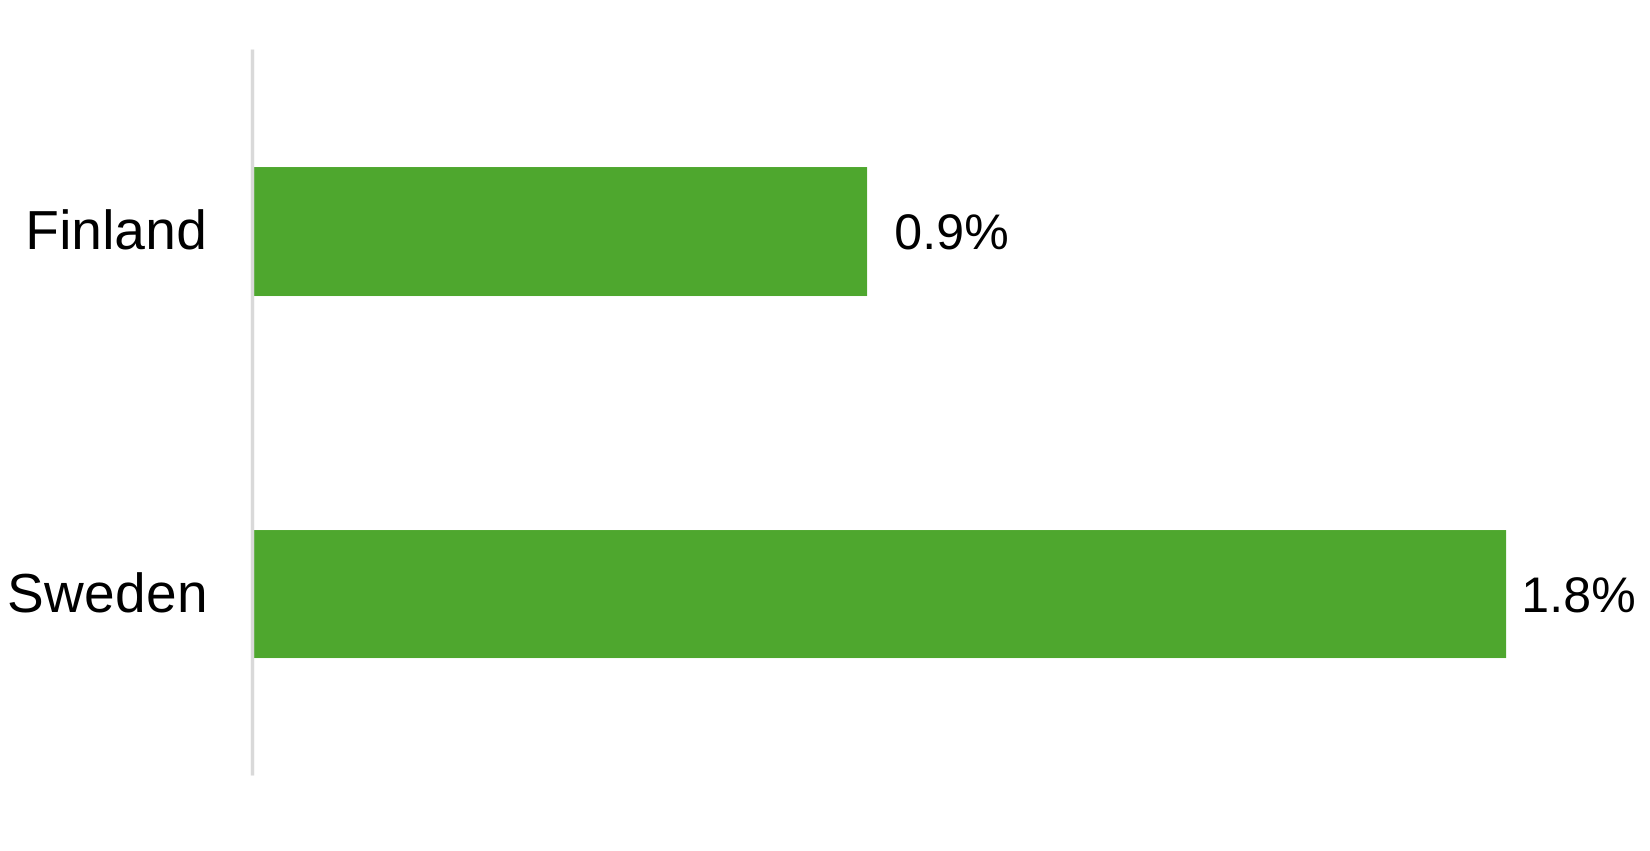
We turn to GDP growth in total (Figure 3). Sweden has had a substantially higher growth rate.
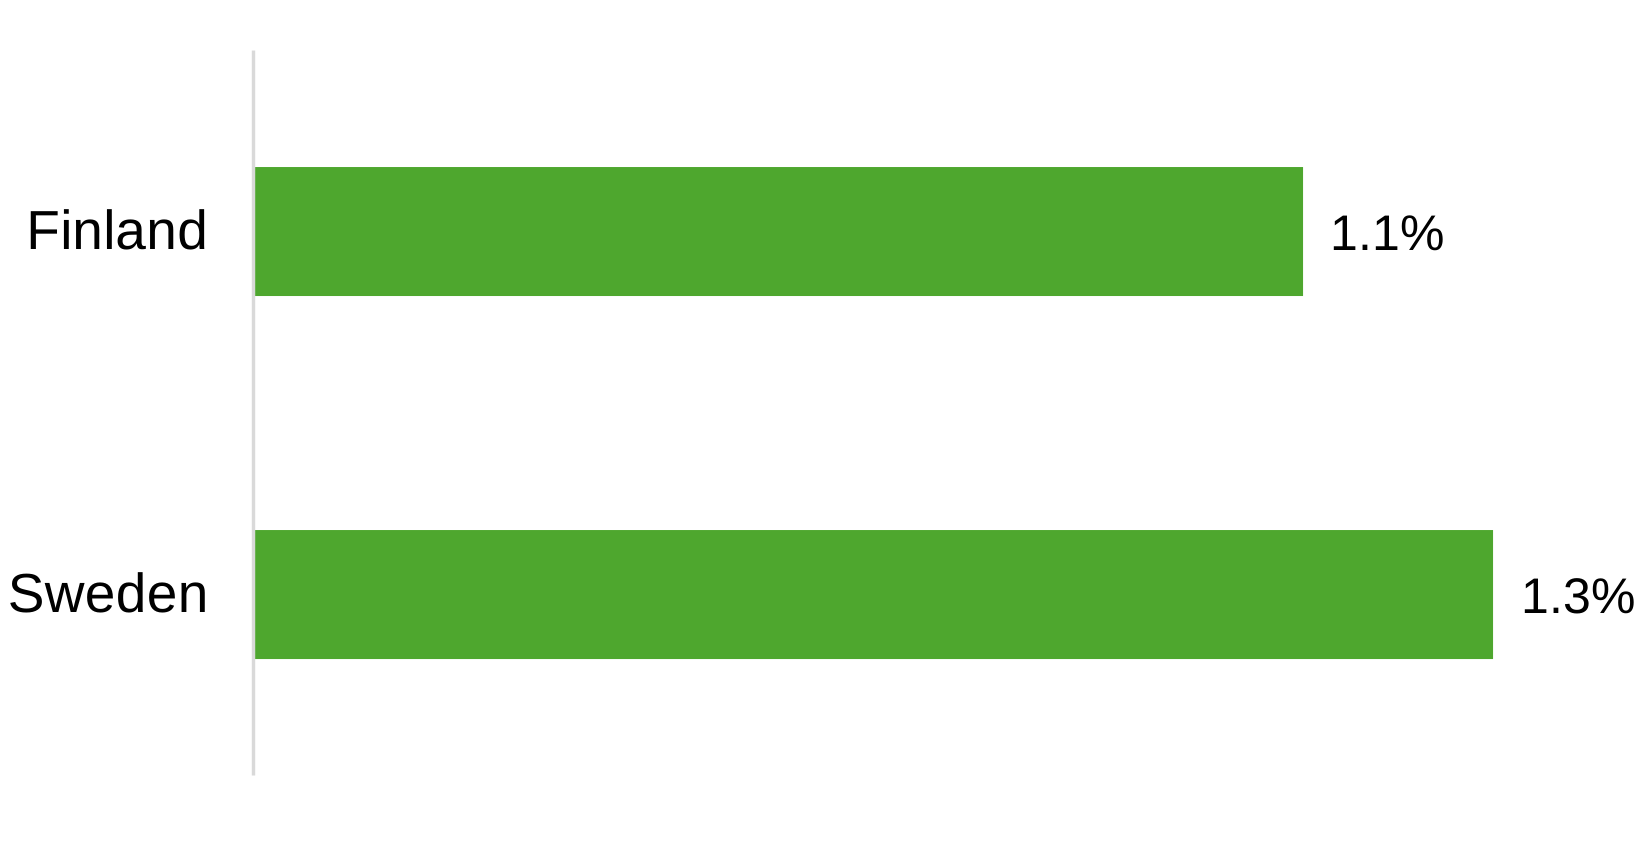
However, this combines economic and demographic contributions. A better metric is growth in GDP per working-age population. With this, the gap narrows considerable (figure 4).
3. Gross Domestic Product and Capital Formation
Labor contributes around 60% of GDP in both Finland and Sweden. The rest is contributed by capital (fixed assets such as factories, robots, buildings, R&D) and more.
Capital has grown 1.1% p.a. in Finland and 2.7% p.a. in Sweden. Has the capital been put to good use? Not at all in Sweden, and weakly in Finland (figure 5). Capital destruction is massive in Sweden.
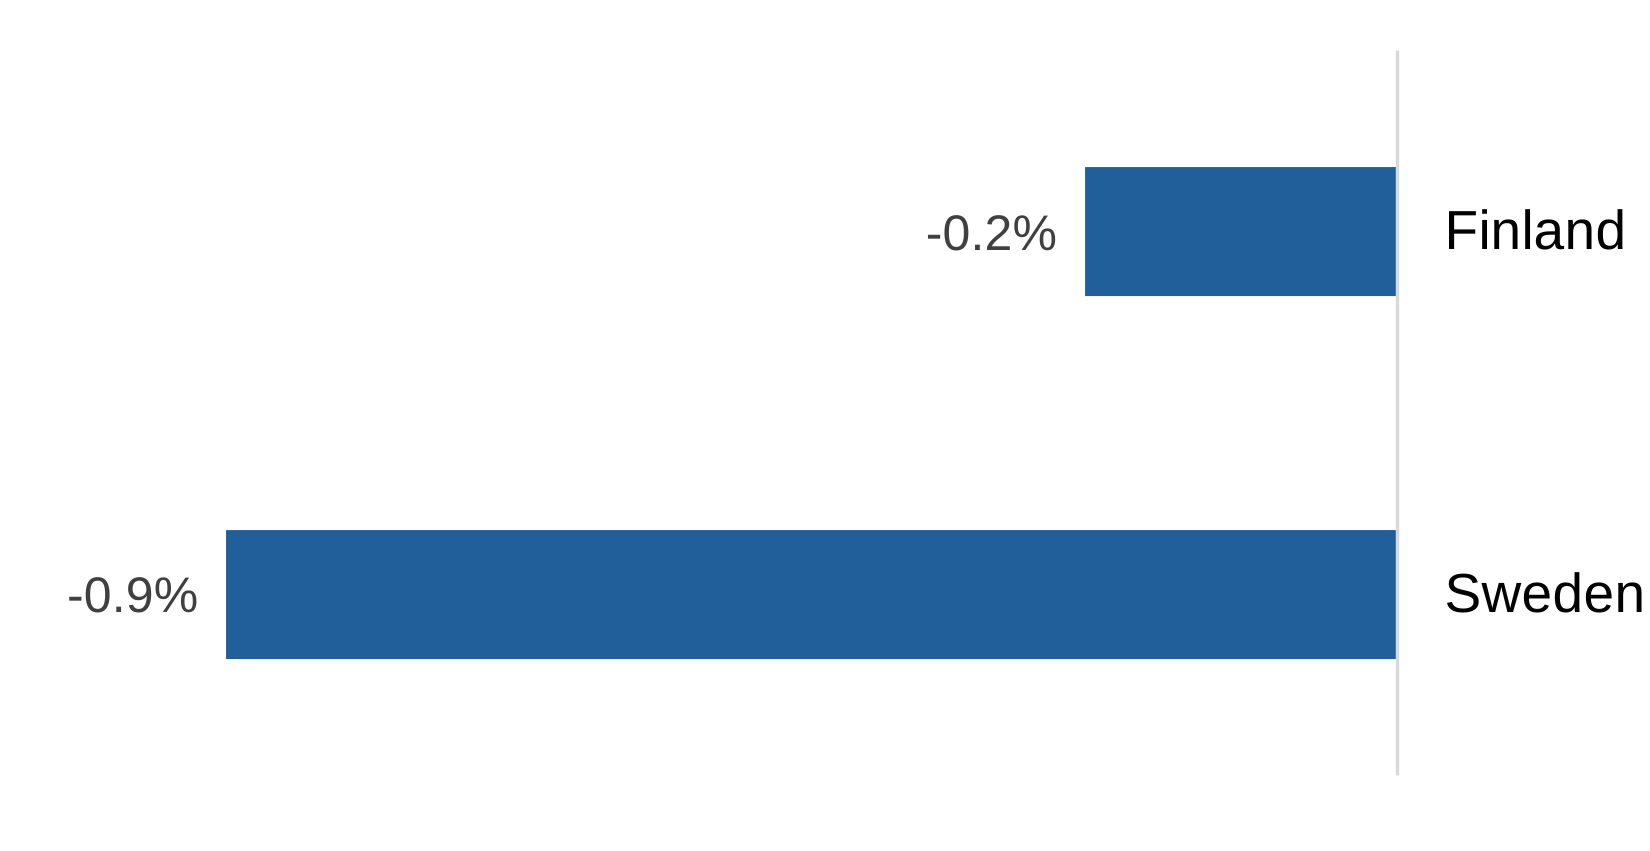
Technical note: The interaction effect between labor and capital (often called deepening) have been eliminated so these are “pure” labor and capital productivities.
4. Total Factor Productivity–The Thing That Really Matters
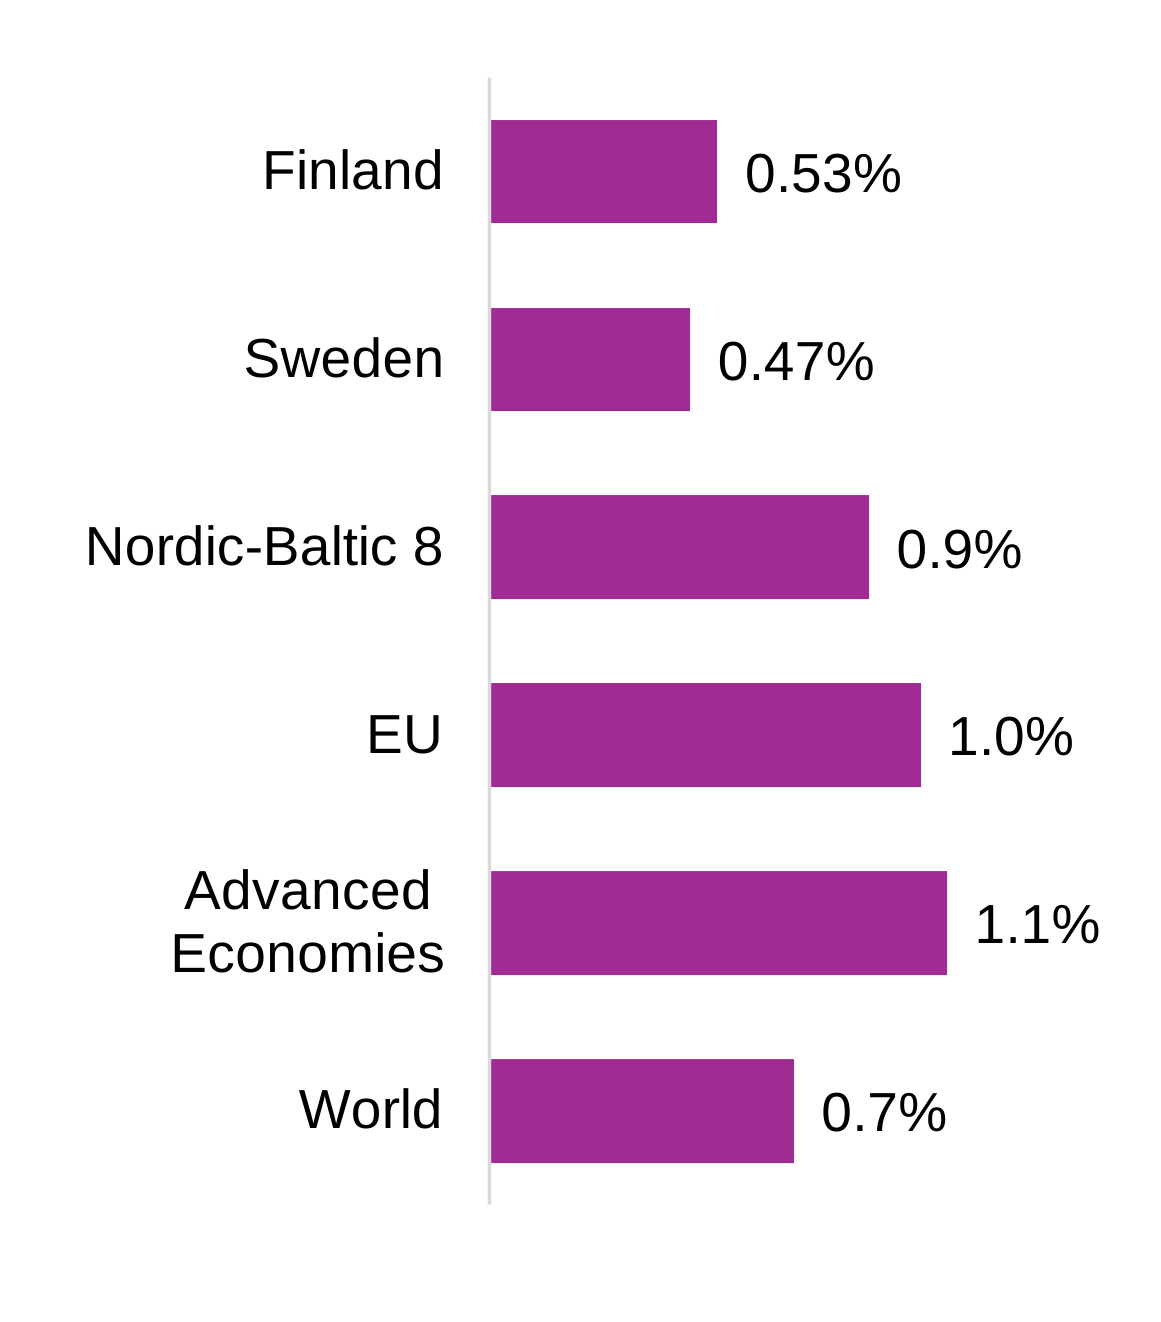
So how has each country performed in total? Have they become “better” or “worse” over the 15 year period. This is measured Total Factor Productivity (TFP). Without going into how this is calculated (it is a direct outcome of the graphs above, and surprisingly easy to calculate: plus, minus, multiplication), Finland has a slightly better performance than Sweden (a decimal has to be added to show the small difference).
A few regions have been added. In comparison to these, neither Finland are doing well (figure 6). (The U.S. is infinitesimally below the EU.)
Source for all figures: Paragonal Productivity System by Tellusant