
A Scientific Evaluation of World Cup Performance by Country 2002–2026
By Dr. Staffan Canback, Tellusant, Inc.
How have countries performed at the World Cup this century? A composite score by country is created by applying the Zipf distribution.¹
The Zipf distribution is a wonderful tool. It is, for example, used to understand the size-distribution of cities, of companies, and of words. Datasets where the smallest value is zero are often Zipf-distributed.
The formula is simple. The largest item has the weight 1; the second largest 1/2, third 1/3, and so on till the nth item with weight 1/n.²
We applied this in two ways to football performance over the seven world cups this century.
-
Each team that reached the round of 16 in a given year was given a Zipf weight. The gold medalist 1, silver 1/2, etc. This created 7 sets of 16 teams with weights.
-
The most recent year (2026) was given weight 1, down to the most distant year (2002) with weight 1/7.
The two dimensions were finally combined to create a total score by country. Higher placement in recent years get the highest score. The sum across all countries is 1000 and if a country had won all seven world cups, it would have 296 points.
The Zipf distribution strongly favors high placement and recency. Some may argue too strongly. Alternative distributions are, e.g., half-life and rectangular distributions. We have found Zipf often have the best characteristics. Zipf is also theoretically grounded.
The graph shows the ranking before the 2026 quarterfinals are played. All other data is final. This means that there will be some movement and we will update the graph after quarterfinals, semifinals, and final.
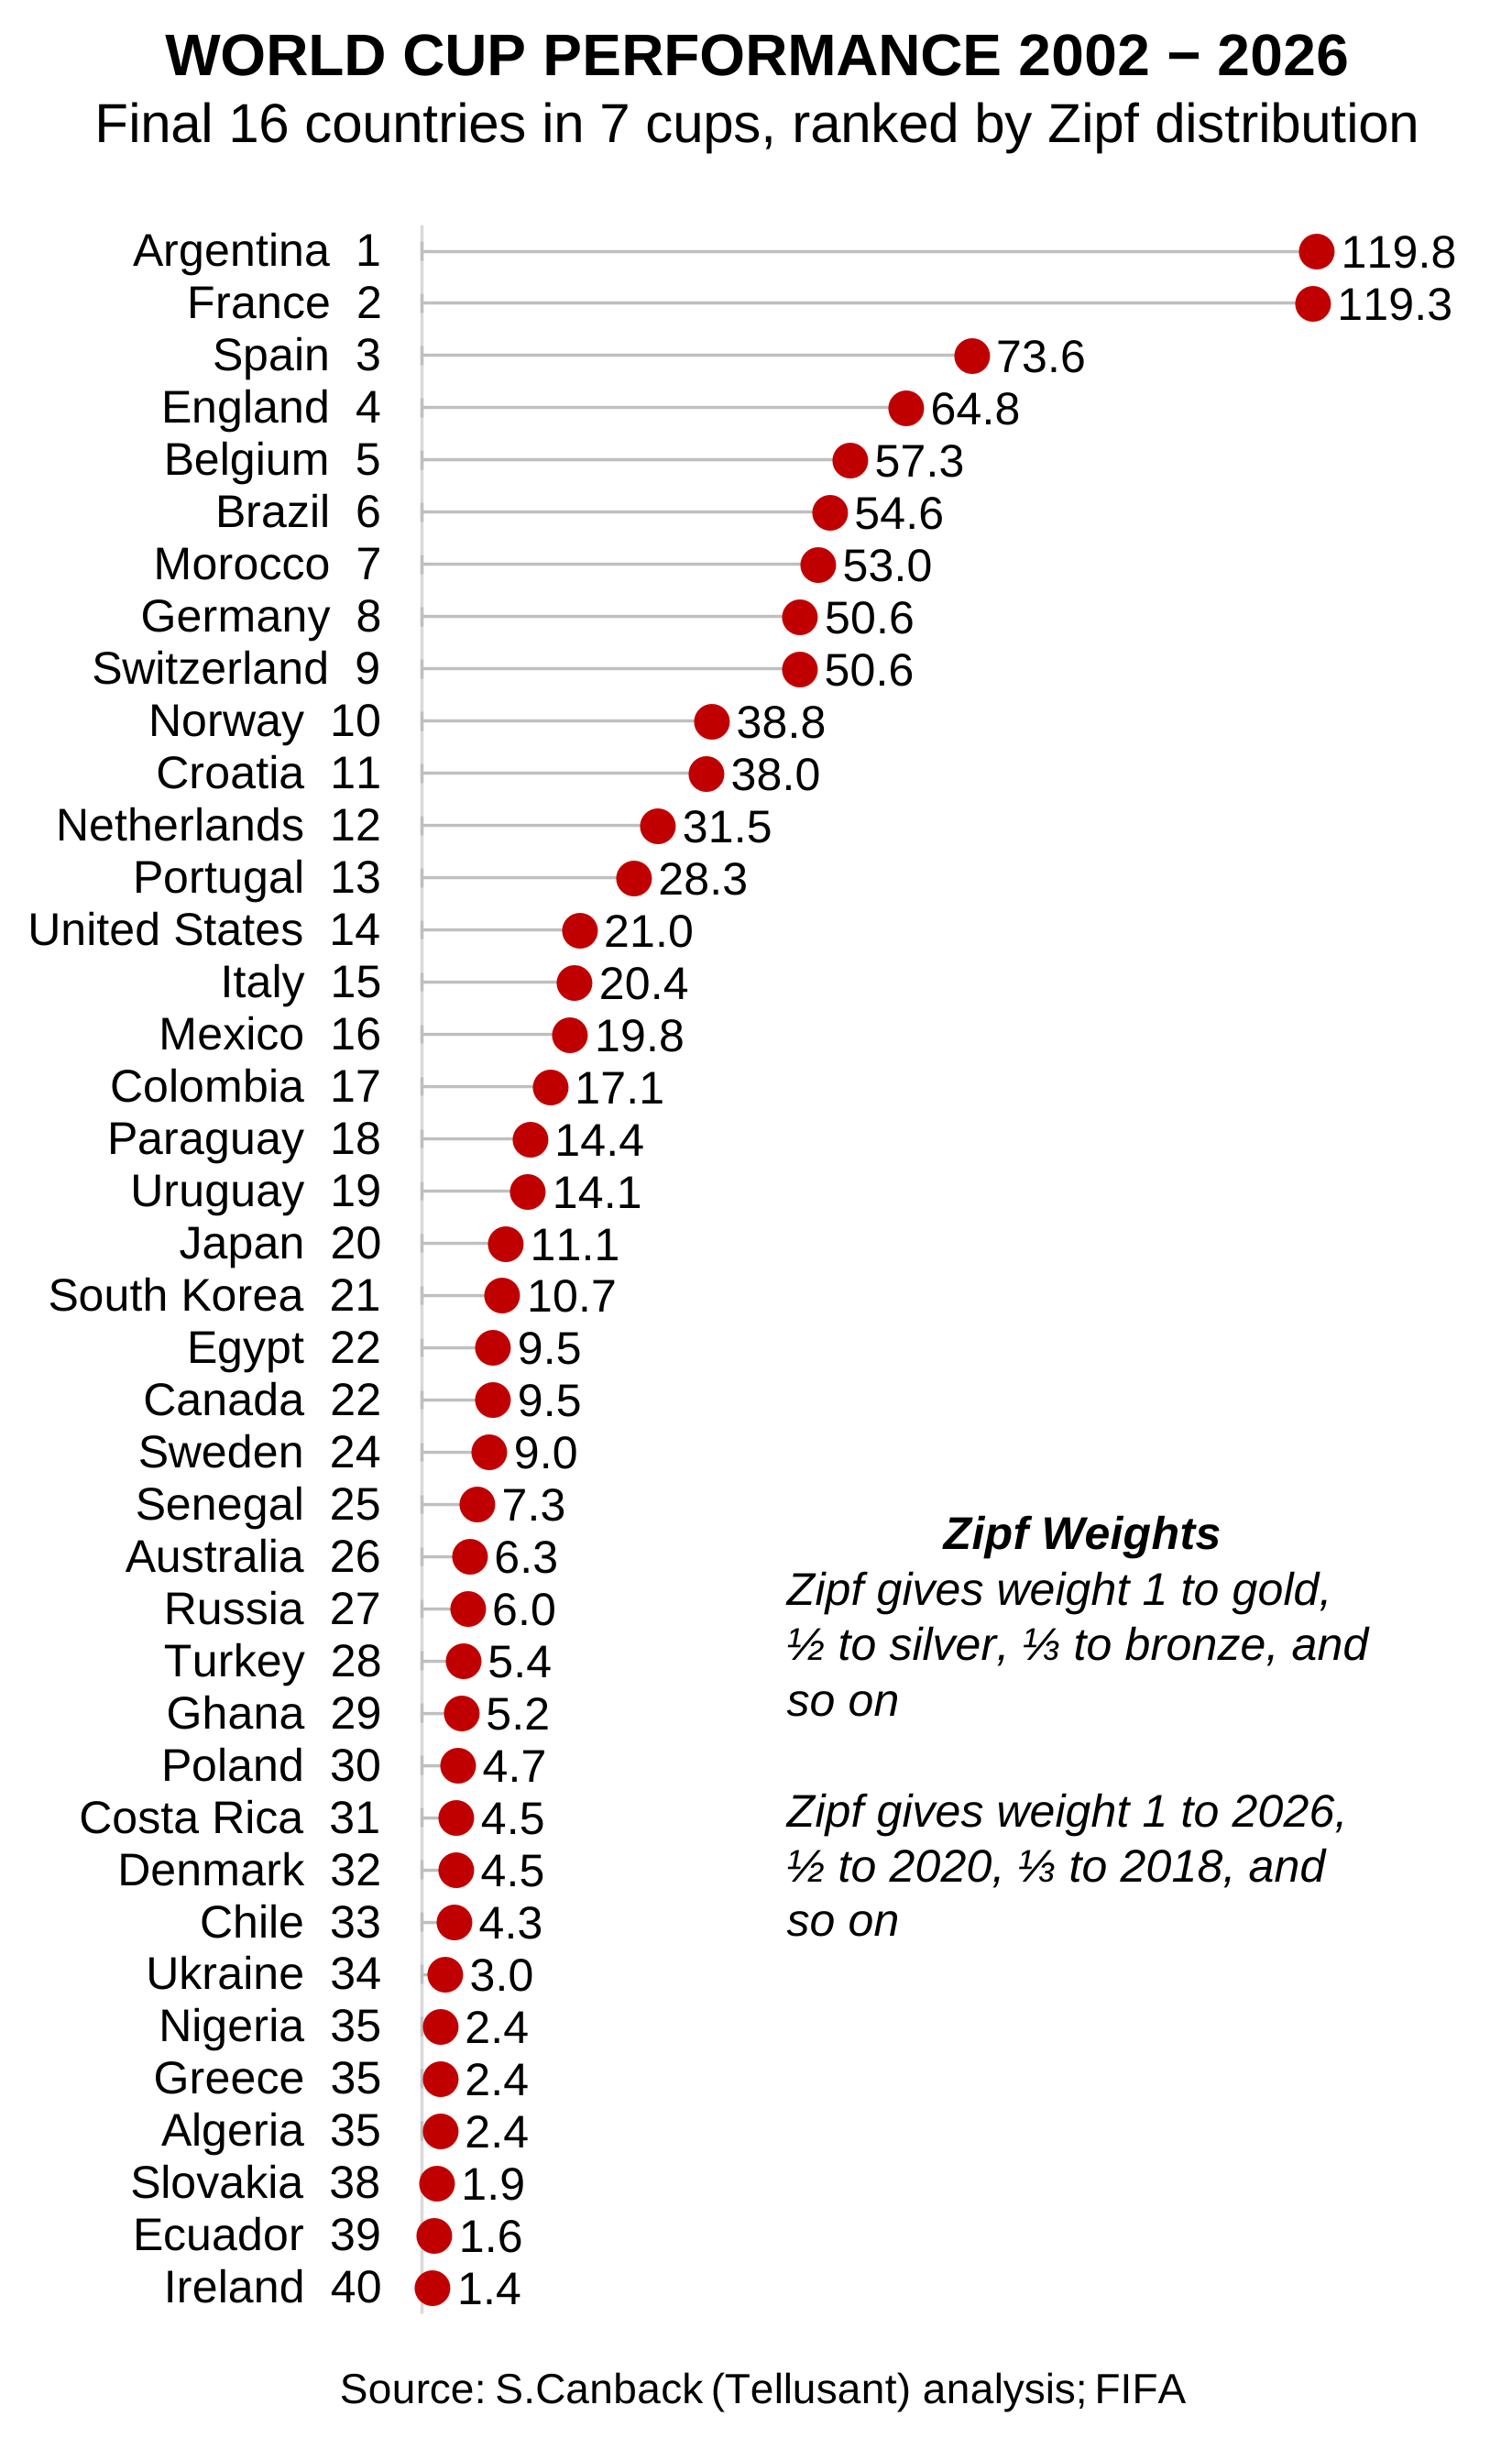
This post is primarily about illustrating Zipf’s usefulness. We applied it to a popular topic to make it more enjoyable.
¹ Zipf is the ranked, discrete form of the continuous Pareto distribution. They describe the same underlying phenomena.
² Well, not that simple: There is also a normalization constant $\frac{1}{H_N}$ where $H_N = \sum_{k=1}^{N} \frac{1}{k}$. In this post I multiplied by 1000 to make the scores range from 0 to 1000. Thus, $H_N = 1000 \sum_{k=1}^{N} \frac{1}{k}$